Context
The G20 Global Initiative on Reducing Land Degradation and Conservation of Terrestrial Habitats (referred to as the Global Land Initiative or the initiative), was launched in 2020 during the Saudi Presidency of the G20. The initiative has a global ambition of a 50 % reduction in global land degradation by 2040. In addition, the Indian presidency of the G20 has decided to take the lead in the restoration of abandoned mining areas among other goals. Using various restoration technics, abandoned mine areas for gravels and other non-toxic ore can provide an opportunity for land restoration. There are many successful examples of how such areas, after ecological land restoration can be transformed into new biodiversity havens or even agricultural land.
Mining activities are often difficult to detect from the ground, especially in complex and country-wide analyses. This pilot study explores harnessing the use of Artificial Intelligence – Deep Learning technologies and multispectral satellite imagery to analyse and monitor the mining sites and tailings dams of different shapes and dimensions and in different geographical zones in South Africa but also their evolution and status active/inactive over time. The final goal is to detect the candidate areas in need of land restoration.
In this study, we used freely available multispectral satellite imagery data (Sentinel 2 and Landsat 8) in combination with new and open-source technologies such as AI (deep learning), cloud computing – Google Earth Engine and the corresponding open-source software and libraries (Tensor Flow, Google Collaboratory, QGIS, Python and R programming and libraries).
The study has been divided into several phases. The first one consisted of the creation of the training data set of satellite images and, subsequently the generation of the AI-trained model, which was followed by a validation phase before its use for predictions. Two types of predictions were subsequently performed, one to determine the change of mining sites over a relatively small scale but for four successive years, and one at the scale of South Africa (and Lesotho) for the years 2018 and 2021. All these phases aim at the same goal, building a trained AI model for large-scale predictions of surface mines and tailings dams, through time.
In this study, we have demonstrated that we can use Artificial Intelligence and more specifically Deep learning techniques to detect mines and tailings dams in free multispectral satellite images, while using open-source software and code reusage. The study was performed over the area of South Africa, from which we also extracted the training dataset for the AI network.
AI training and predictions
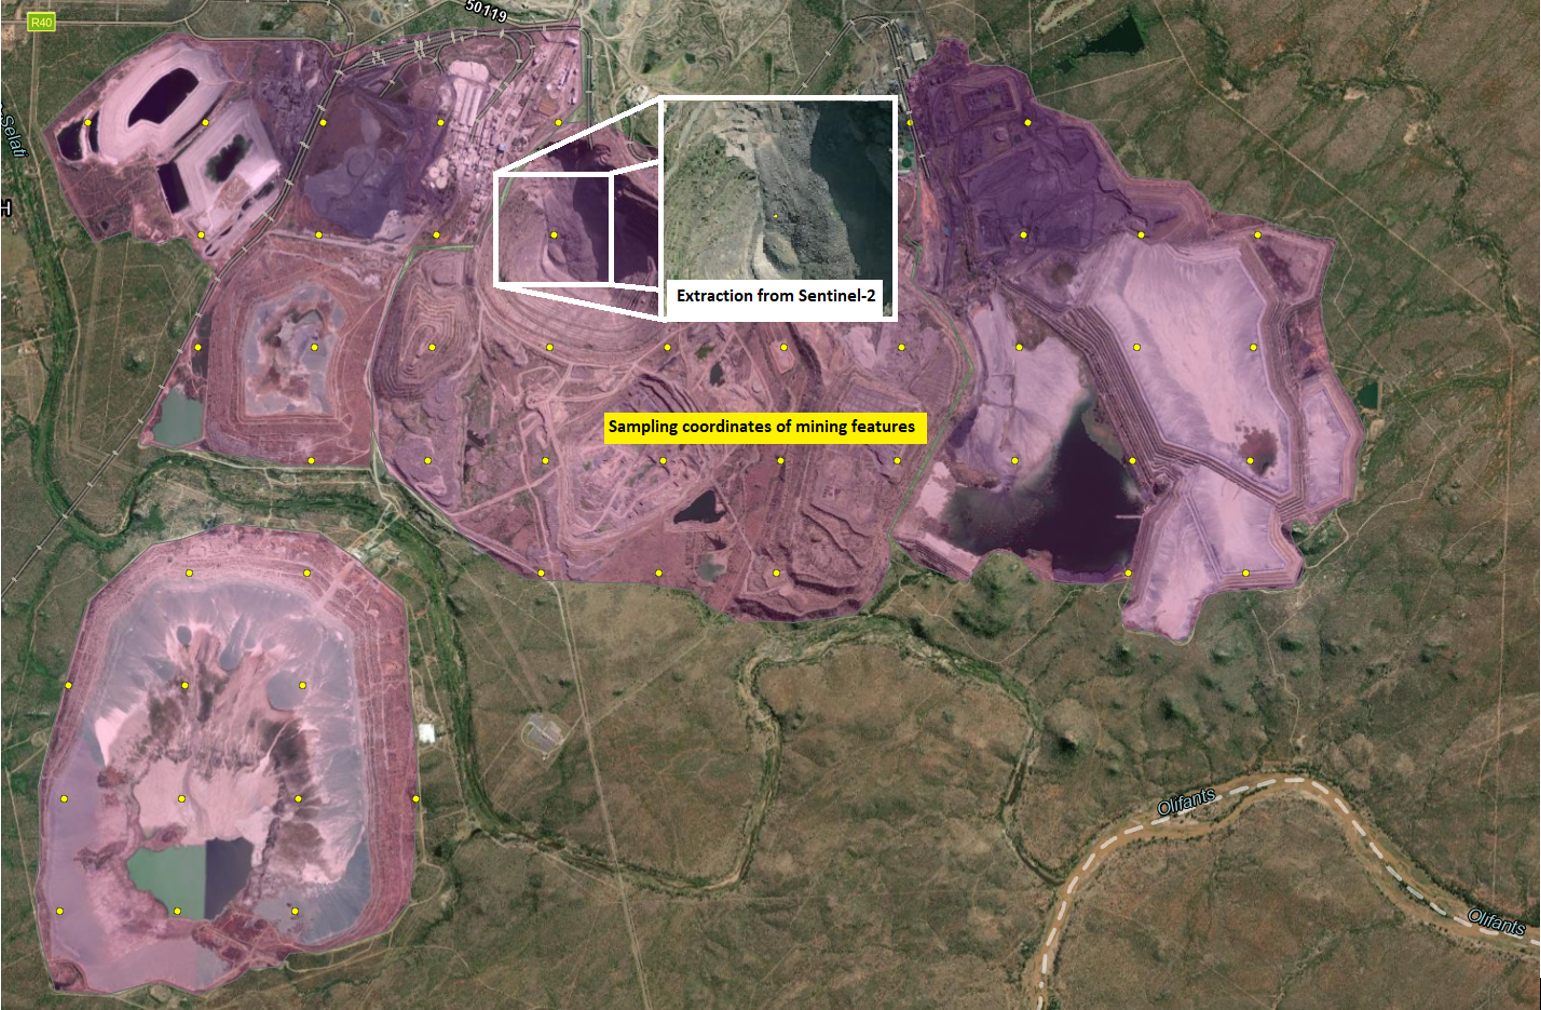
The training dataset is based on the Global Dataset by Tang & Werner (2023), which is a global dataset of mines (both active and abandoned mines) comprising 74’548 polygons, covering globally ~66’000 km2 of features like waste rock dumps, pits, water ponds, tailings dams, heap leach pads and processing/milling infrastructure.
We used patches of 1km x 1km x 12 bands of Sentinel 2 multispectral images for training, which were extracted using Google Earth Engine and filtered based on their cloud coverage (less than 20% cloud coverage). The training images are extracted over one year (2021) and the median operation (median value at a location-based pixel values of all images during that year) is applied to define a single raster image representing that year. Each of the resulting images is therefore labelled as either containing a mine (part of a mine or tailings dams) or just background information. We have extracted a balanced number of training images containing mines (2000 points) and background images (not containing mines) (2000 points) to avoid introducing class biases to the algorithm. Considering the local characteristics of South Africa environment, the algorithm might still contain biases regarding especially the geographical areas in which the mines occur.
The deep learning methods used for this work was inspired by Balaniuk et al., 2020, in which the authors use a deep learning algorithm to detect mining and tailing dams in Brazil and they also analyse the mines’ environmental impact. Unfortunately, the training dataset used in their work is not openly available to be reused, but the AI code was of great inspiration.
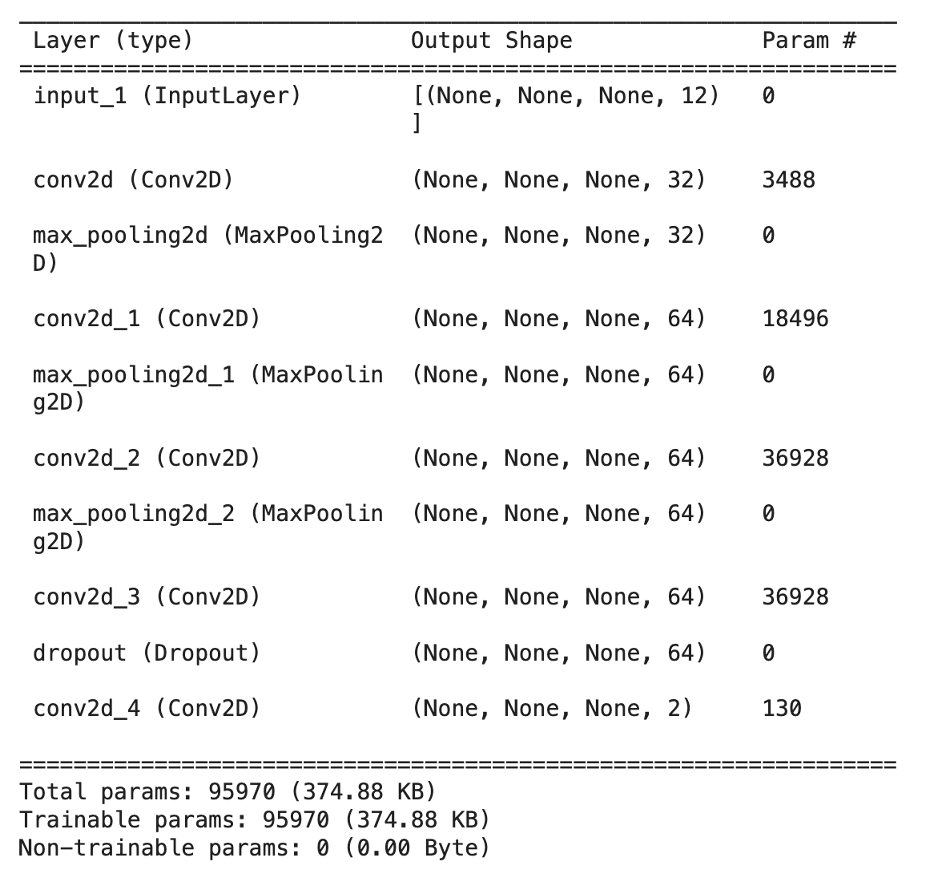
The mines and tailings dams deep learning detection algorithm is a fully convolutional neural network composed of several layers: three convolution layers, two pooling layers, and a dropout layer used to regularize the algorithm (Figure 3). The input of the algorithm (Layer 1) is not fixed, the height and the width of the input image are not specified, except the number of 12 bands used from the Sentinel 2 images. This allows the algorithm to accept images of different sizes, other than 1km x 1km used for this work. The output layer is a convolution layer with a 1 x 1 kernel and two filters which correspond to the two classes used for classification: mine and background (other).
Both the training and the prediction of the AI was done using the Google Colaboratory (Colab) tool which is an open-source cloud service based on Jupyter Notebook, highly used for machine learning applications. Using this service, we have access to a flexible runtime configured for machine learning algorithms and to GPU (graphical processing units) based computing. Depending on the size of the training and predicting data, additional GPUs and memory can be added per month for a certain cost. All the data needed for the algorithm (files, satellite images, training data, predicting data, etc.) can be stored and accessed via Google Drive, which simplifies the data transfer and the need to configure dedicated storage places for your data. For this work we have upgraded both the GPU/memory level in Colab and the Google Drive storage to be able train the AI but also to download all the data needed to make predictions for the entire South Africa for several years.
The prediction of the AI can be applied on small areas (by dividing the area in 1 x 1 km patches) but also on large areas (by extracting large Sentinel 2 images to cover the wide area and dividing them in smaller patches before prediction). The Deep learning technology in combination with Sentinel 2 multispectral images proven to be quite successful in automatically detecting mining sites, with an accuracy of over 90%.
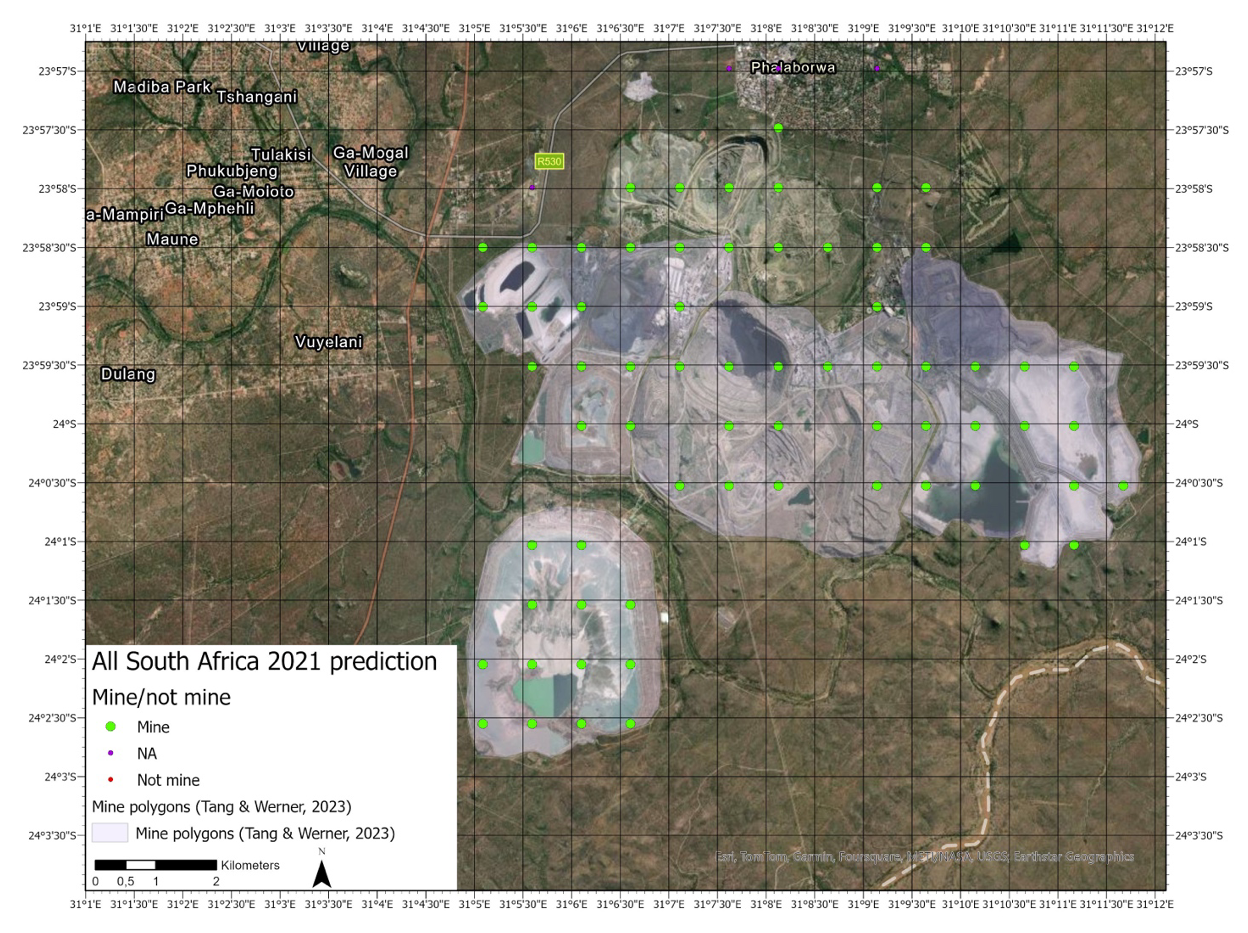
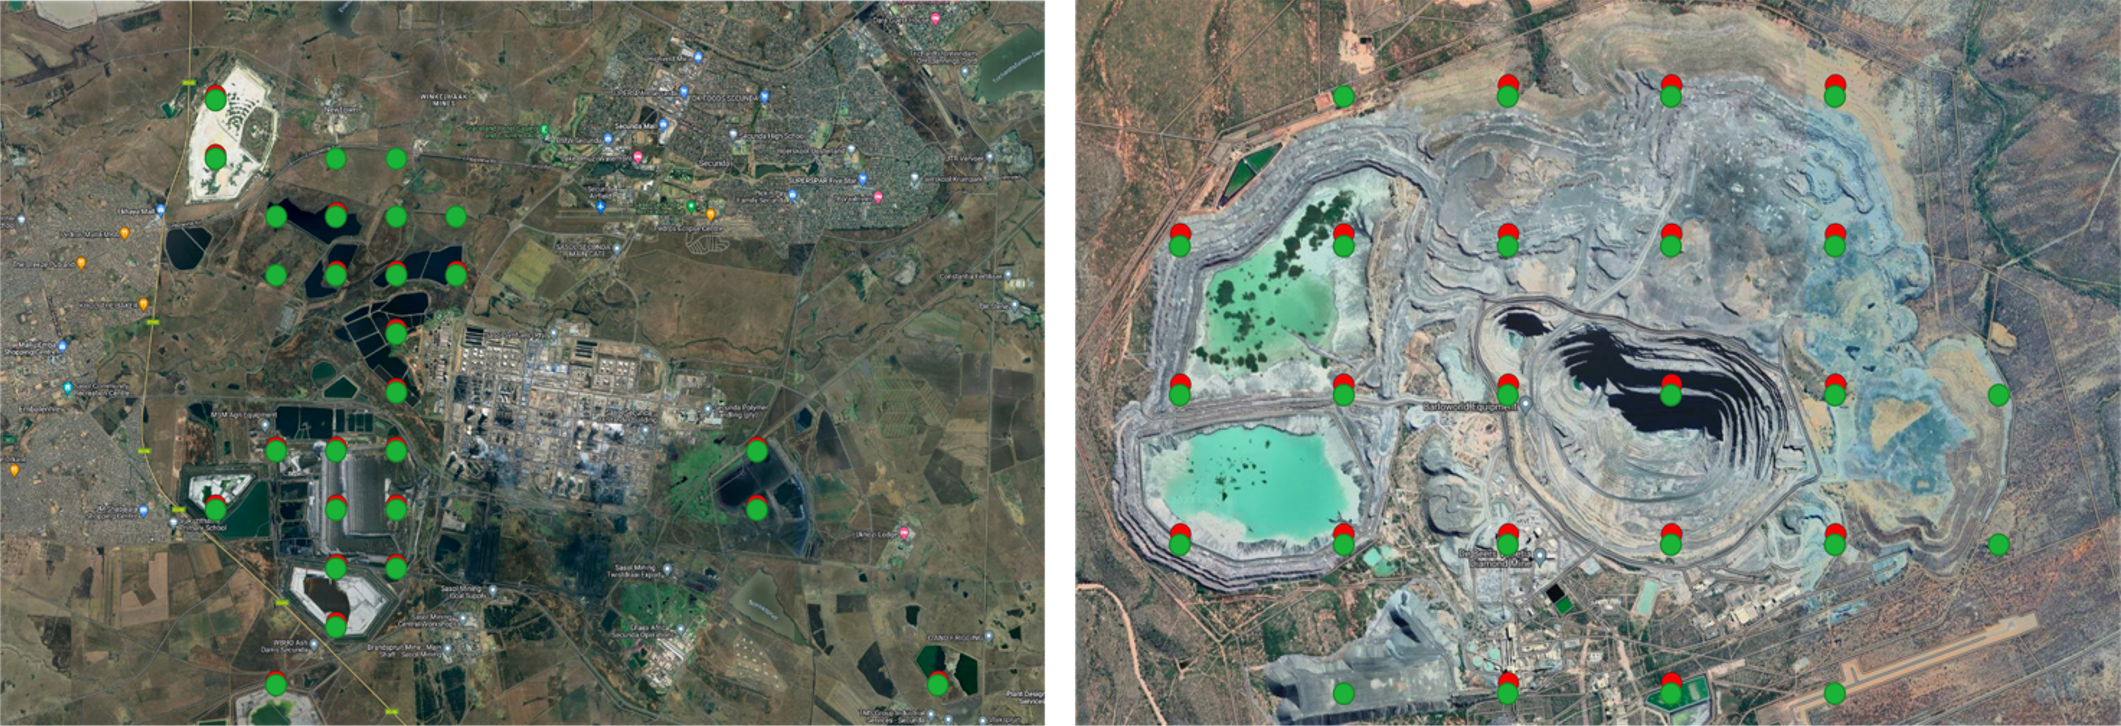
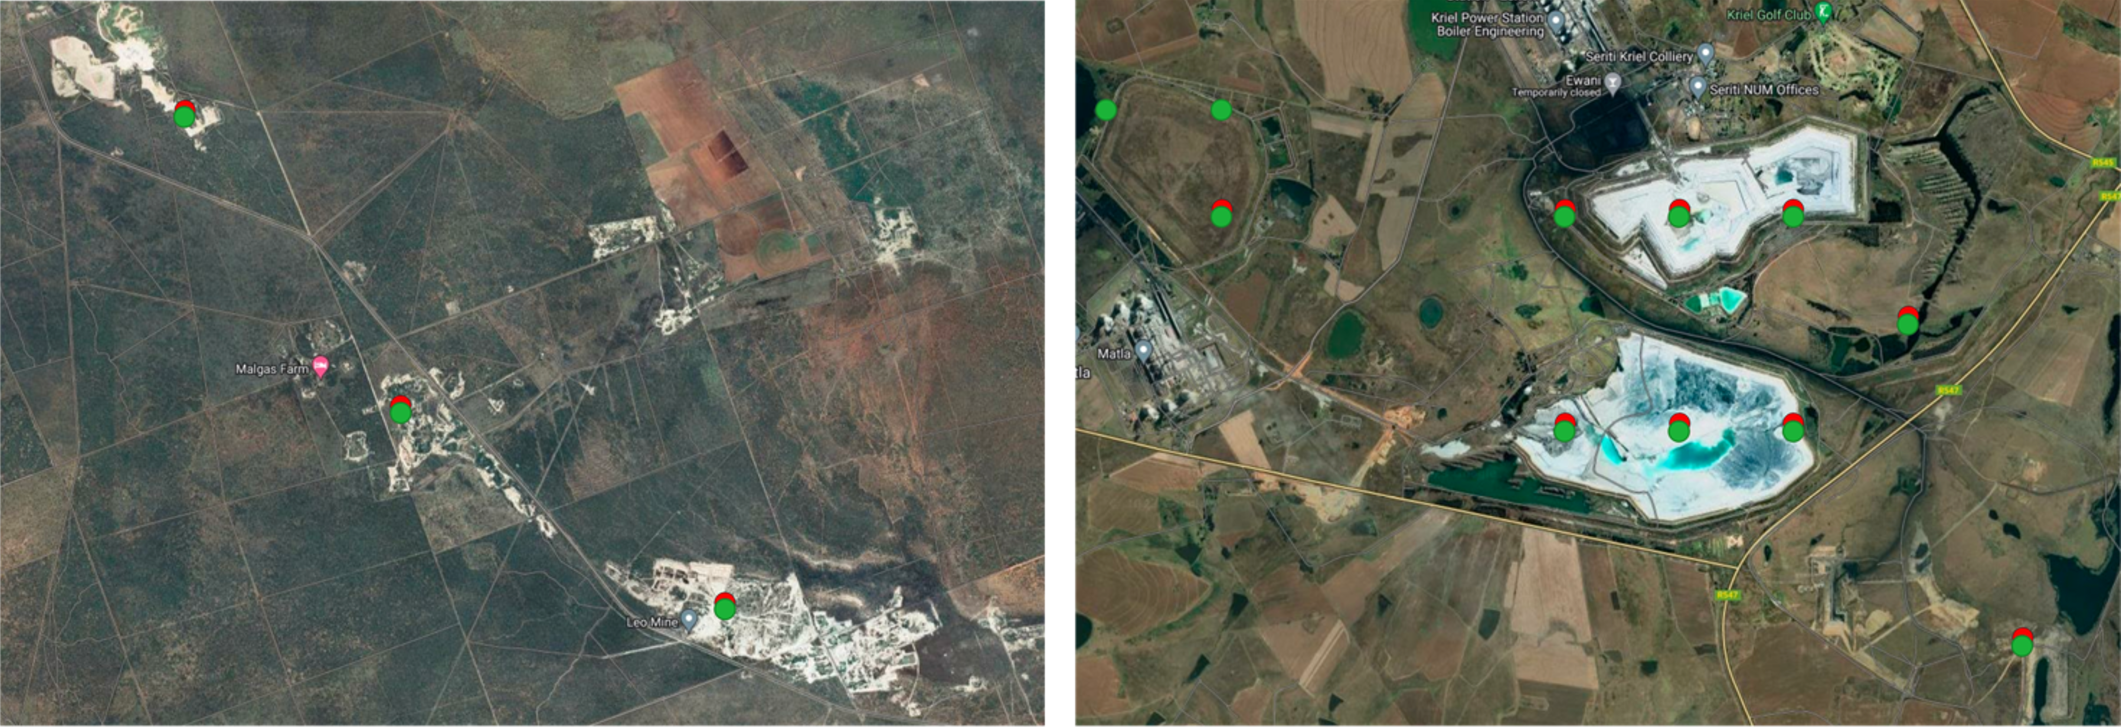
Examples of mines detection over small areas:
Prediction of the entire South Africa for 2018
The prediction at the scale of the entire territory of South Africa and Lesotho was done on 300 large Sentinel 2 images covering the entire area of the smallest rectangle fitting around South Africa. These large images were further divided into patches of ~1x1 km. The prediction returned a total of 86’058 points that were considered as a mine at the scale of the whole bounding box, which were reduced to 71’134 points after discarding the points falling outside the investigated territory of South Africa.
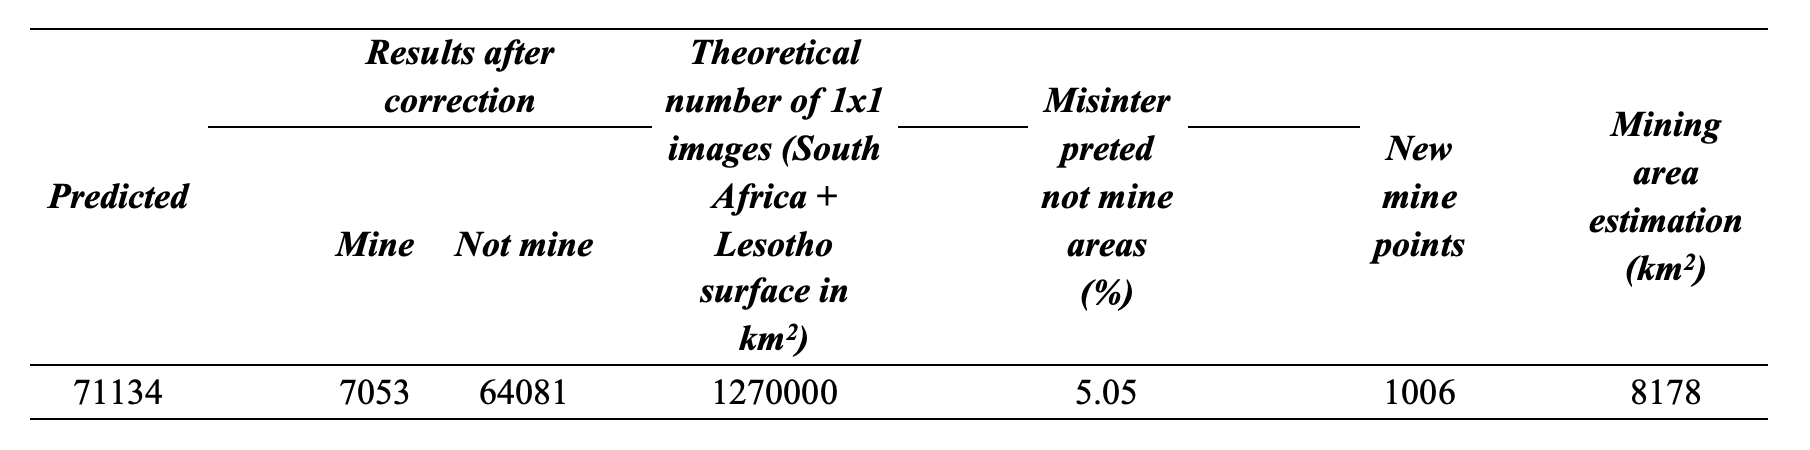
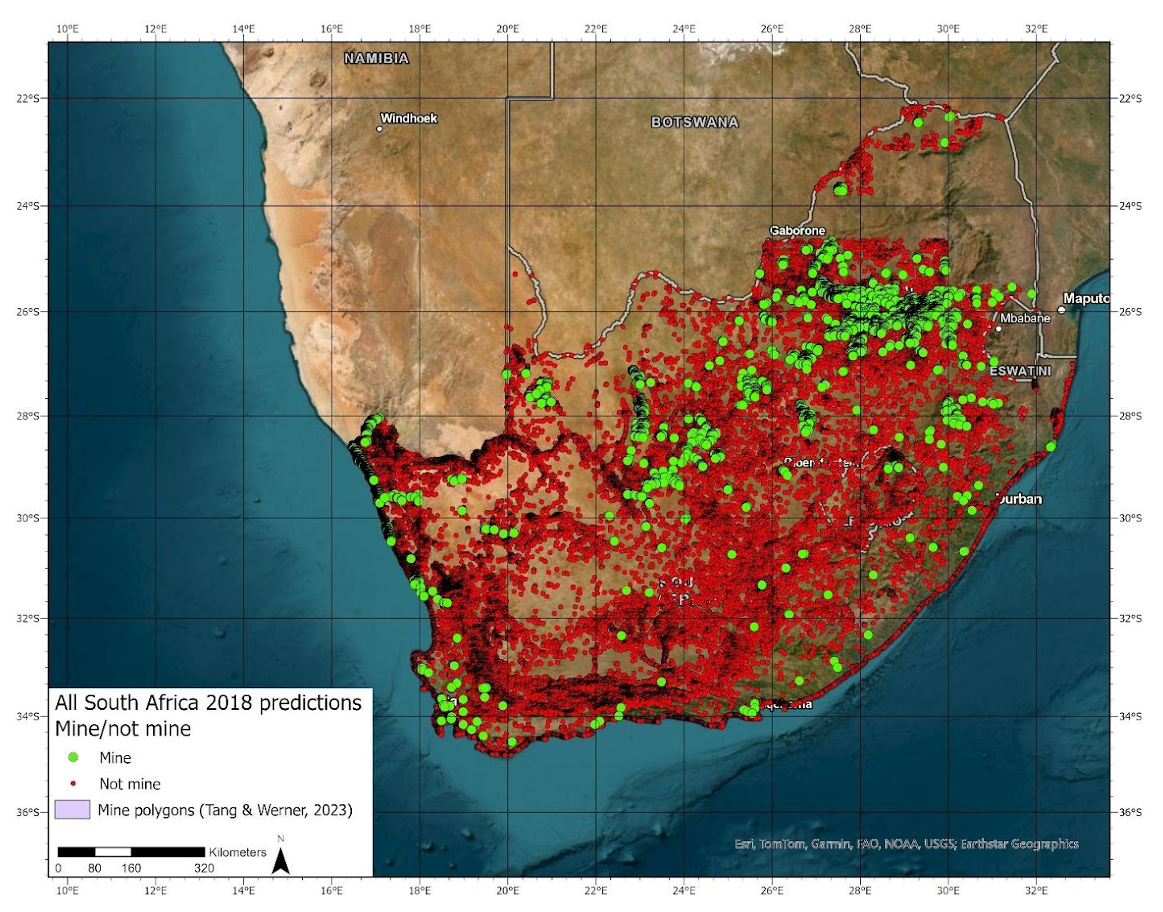
After manual correction the final number of “mine” points, i.e. points corresponding to ~1 x 1 km satellite images that contain a mine site, was 7’053 (Figure 6, Table 1). The number of misinterpreted background images, i.e. the number of points that were incorrectly interpreted as mine points is 64’081 (Figure 6, Table 1). This number appears like a very large proportion of error compared to the number of detected mine points. However, considering the total area of the investigated territory (South Africa + Lesotho) that is of around 1.27 million km2, and the fact that we predict using 1 x 1 km images, the total number of not mine (or background) points should be of ~1.27 million, considering that the 7’053 mine points can be neglected at that scale. Accordingly, the misinterpreted not mine areas only represent 5.05% of the total territory, i.e. ~95% of the territory was correctly interpreted. This result demonstrates the very high precision of the prediction.
Table 1: Summary of results obtained during the prediction of the entire South Africa (and Lesotho) territory for the year 2018. The theoretical number of 1 x 1 images corresponds to an approximation of the number of the “not mine” points expected at the scale of the territory, considering that the ~7000 “mine” points are negligible in comparison. The mining area estimation has been carried out using a buffer of 750 m around each mine point.
The prediction carried out at the scale of the entire South Africa (and Lesotho) (i) yielded 1’006 new mine points, i.e. several tens of newly detected mine sites of any size that were not present in the inventory of Tang and Werner (2023), and (ii) showed that only 5.05% of the non-mine areas were misinterpreted. Even though the trained AI model provides good results, the 5% misinterpretation of non-mine areas at the scale of the investigated territory led to manual corrective labelling of tens of thousands of points that imply days of manual correction.
The AI also shows recurrent misinterpretation across every prediction such as agriculture patterns (majority), roads in the countryside, rivers, lakes with sharp shores, dams, residential areas, steep slopes in mountain ranges that look like open pits, beaches, or the almost entire Lesotho territory. These recurrent misinterpretations are to be attributed to the randomly selected background training points that are not representative of the listed areas.
Even though the predictions show good results with a low rate of misinterpretation, the 5% of misinterpretation at the scale of the investigated territory and the recurrence of the errors indicate that the AI can be improved for future applications.
Mine sites within protected areas
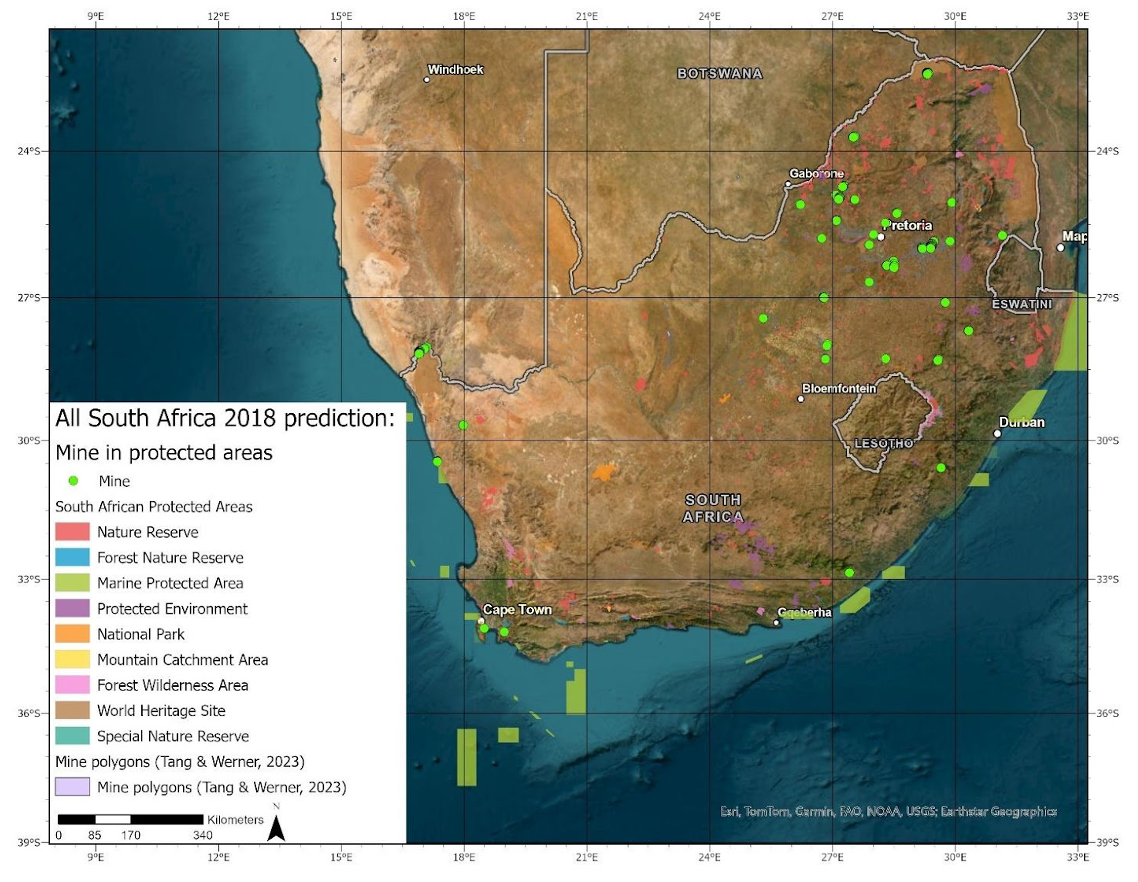
A comparison between the location of all the mine sites identified in the prediction of the entire South Africa (and Lesotho) territory for the year 2018, and the protected areas shows that 183 of these points fall within national or international protected sites, that include world heritage sites, nature reserve (private and public), protected environment and national park (Figure 7). They represent ~185 km2 of mine sites, i.e. 2.3% of the total estimated mining area of the territory. Since some of these protected areas were declared as early as 1955, they were created before any current mining activity. A further detailed investigation of the legislation of the Republic of South Africa relative to mine site opening and of the legal status of the corresponding protected areas would allow to better constrain the legal or illegal status of the considered mine sites.
Detection of abandoned mines
Directly identifying an abandoned mine on satellite images for a specific year can be very challenging. When an area is abandoned by humans, nature begins to reclaim it. The ecological succession and morphological change upon abandonment of a mine site depends on a wide variety of factors such as climate, the surrounding morphology, the surrounding ecosystem and the surrounding land use in addition to the nature and duration of the disturbance. Rather than treating a mine or an abandoned mine as a static feature, we argue that recognizing an area on satellite images as an abandoned mine is easier when the entire evolution from the active mine to the point of abandonment is analysed. This is particularly true given that there is no global database of abandoned mines with which an AI can be trained.
During this study, we carried out a prediction on a small area but through four successive years from 2018 to 2021. The results of this prediction demonstrate the reliability of the trained model in detecting new mine opening, but more importantly it seems able to detect the closure of mine sites since 41 points (5%) show a lack of detection after being detected in previous years. The mandate provided by the UNCDD for this study aimed to test the ability of detecting the evolution of mine sites and tailings dams using AI and remote sensing, especially to identify the abandoned mines and the associated risks. Accordingly, the results presented here represent a first step towards this goal. The points not detected anymore in later years need to be investigated in detail to extract the characteristics that are interpreted by the AI trained model as evidence for closing. Similarly, mining sites whose outline remain unchanged over a few years should equally be investigated further. The absence of mine site expansion is an indicator of the abandonment of the mine. These points should be used as a starting point in a next phase to aim at detecting closed mine sites.
Data access
For more details, please see the full:
The training and small area prediction data points in South Africa can be download from:
Presentation slides are also available: